h-index: 18 i10-index: 25
h-index: 18 i10-index: 25
Document Type : Original Research Article
Authors
1 Department of Engineering, Behshahr Branch, Islamic Azad University, Behshahr, Iran
2 Department of Engineering, Sari Branch, Islamic Azad University, Sari, Iran
Graphical Abstract
Keywords
Subjects
Introduction
|
|
In this paper, the effects of an impact corona on voltage pulses or currents emitted along a high voltage transmission line can also be evaluated by providing a time-varying capacity and a conductivity to the transmission line. If the capacitor of the time variable is assumed to be proportional to the ratio between the load of the impact crown and the applied voltage, one needs to do this and guide the time variable to show the effects of the impact crown more accurately. Reverse stroke analysis as one of the most important current pulses along a high voltage transmission line under the impact corona, suggests that corona effects may be due to the fact that the measured return stroke velocity is significantly lower than the speed of light. Also, based on the results of impact crown effects, the physical justification of the concepts used in the current type of reversible stroke models is properly presented [13-16].
Transmission line equations considering corona effects
Transmission line equations by considering the corona and the effects of the external magnetic field to evaluate the transient current and voltage that usually appear at the input of sensitive electrical equipment. In Figure (1) the air conductor is located along the x-axis and the height h. The conductor radius is ra. In the ground z 0 includes air. E (x, y, z, t) is the total electric field and B (x, y, z, t) is the magnetic flux density at the transmission line. Faraday's law is applied to the part designation as a dotted line in figure (2). On the left side of the equation, the line integral is taken from the electric field, and on the right side of the equation, the magnitude of the magnetic flux changes is calculated.

Figure 1. (a) The shape of the transmission line in the absence of a corona (b) derive the equation of the transmission line


In this inference Ex (t, x, 0) is considered zero. By dividing the two sides of the equation by dx and taking the limit that dx is zero, we have:

The total magnetic field adjacent to the line consists of the sum of the scattered magnetic field and the random magnetic field. S represents a scattered magnetic field and i represents a random magnetic field.


To obtain the distributed voltage with integral from the surface yz, we have:

By substituting (8) and (9) in (7) we have:

In order to simplify (10) Faraday law was applied to the components of the random field and we have:

With this calculation, the equation of the first transmission line is obtained:

To derive the equation of the second transmission line, Curl Maxwell must first be considered. The values of the vectors H, J, and D are the magnetic field, current density, and electric flux density, respectively.

The conductor element is located between x and x + dx. The corona increases in this part and it is assumed that during time t, the radius of the corona is Rc (t, x).

The equation on the left is divided into two parts, one for the end of the cylindrical element and the other for the surface. And from the left of equation (15) we can conclude (18):

And the total electric charge on the transmission line is given below. C is the capacitance of the line. And for each value of Vs, qa (t, x) is defined.

In the boundary conditions of the end of the line with impedances Z1 and Z2 with ε1 and ε2 we have:

Electric field interaction
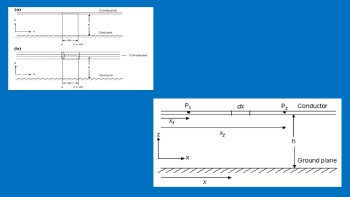
The transmission line equations together with the given boundary conditions are fully explained in the interaction of the transmission line with the external magnetic fields and the corona. Consider the element dx, which is located at a distance x from the origin. The geometry of this condition is shown in Figure (2).

Figure 2. Locations of points P1 and P2 according to the dx element of the high voltage transmission line
The x component represents the electric field of the output with the element Ex (t, x). The interaction of the output electric field happens with the dx element of the transmission line in the form of an increase in the transient infinite current waveform that appears in the opposite direction along the transmission line at a speed of 1/√lc. This speed is similar to the speed of light in the open air for the transmission line in the air. By ignoring the resistance of current shocks at points p1 and p2, the results of the interaction of the electric field of the output and the dx element of the line are given in (24) and (25).

The flow results at points p1 and p2 due to the corona in the dx line element are shown in Equations (26) and (27). dIc (t, x) is the corona prionite flow.

Simulation results
The effect of corona on voltage and current pulses in the transmission line can be evaluated using the extracted equations. The horizontal conductor of the transmission line with a radius of 1cm and a height of 5m above the ground is considered. It is assumed that
the positive current pulses hit one of the two ends of the line. The peak injection pulse current is fixed at 12KA. In this paper, by giving voltage pulses to the input of the equations, the total current of the line priority is evaluated.

Figure 3. Changes in electrical charge per unit (a) under positive voltage shock (c) under negative voltage shock. Calculated corona current (b) under positive voltage shock (d) under negative voltage shock
Conclusion
Analysis of the high voltage transmission line equations in the presence of the impact corona states that the impact corona generated by a current or pulse propagation voltage along a high voltage transmission line can be used as current sources of the corona distributed along the current source line of the corona corresponds to a given line. When the current in that line element increases, the element turns on. The shock threshold current threshold or when the amplitude of the voltage is greater than the shock threshold voltage threshold. The main current pulses and current pulses generated by the corona move along the transmission line at light speed. The results obtained from pulse propagation in transmission lines despite corona and its implications in lightning strikes showed that corona has two effects on the propagation of pulse current and voltage along the transmission line, the first effect is the reduction of pulse amplitude and the second effect of pulse efficiency whose amplitude is greater than the corona threshold; it moves at a slower speed than the speed of light, and also in the lightning channel, so the higher the altitude, the slower the propagation speed.

| Article View | 24,703 |
| PDF Download | 8,761 |